Every screenshot below is the **real output** of Markdown Renderer for GitHub running on a live WordPress site (not a mockup). Each example pairs the Markdown you write with the result your visitors see.
<a href="https://markdown-renderer.wakalab.dev/2026/06/10/gfm-mermaid-rendering-examples/" target="_blank" rel="noopener">🔗 View this page on the demo site</a>
## GitHub Flavored Markdown
### Tables
Write a GFM table as-is:
```markdown
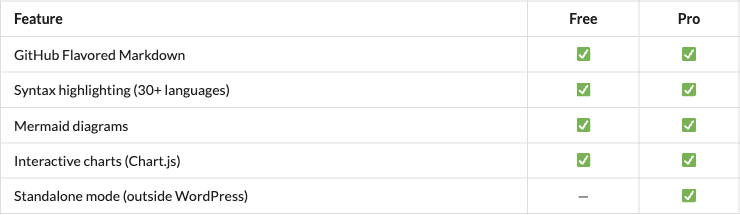
| Feature | Free | Pro |
|---------|:----:|:---:|
| GitHub Flavored Markdown | ✅ | ✅ |
| Syntax highlighting (30+ languages) | ✅ | ✅ |
| Mermaid diagrams | ✅ | ✅ |
| Interactive charts (Chart.js) | ✅ | ✅ |
| Standalone mode (outside WordPress) | — | ✅ |
```
It renders with GitHub-style borders, alignment, and zebra striping:
## Syntax Highlighting
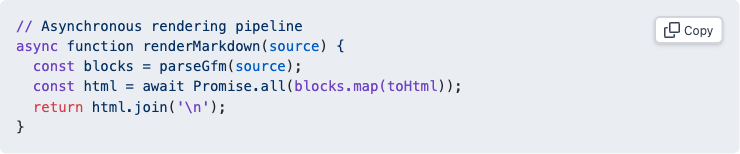
Code fences are highlighted with **Shiki** (the same engine as VS Code) and get a copy button:
````markdown
```javascript
// Asynchronous rendering pipeline
async function renderMarkdown(source) {
  const blocks = parseGfm(source);
  const html = await Promise.all(blocks.map(toHtml));
  return html.join('\n');
}
```
````
## Mermaid Diagrams
### Flowchart
````markdown
```mermaid
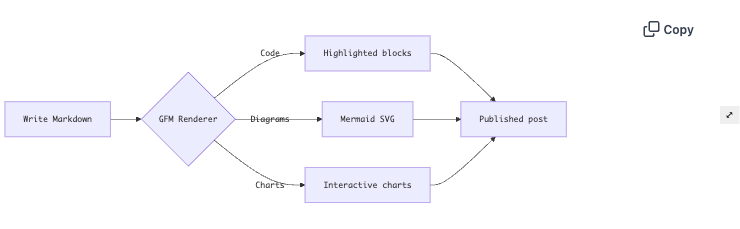
flowchart LR
    A[Write Markdown] --> B{GFM Renderer}
    B -->|Code| C[Highlighted blocks]
    B -->|Diagrams| D[Mermaid SVG]
    B -->|Charts| E[Interactive charts]
    C --> F[Published post]
    D --> F
    E --> F
```
````
### Sequence Diagram
````markdown
```mermaid
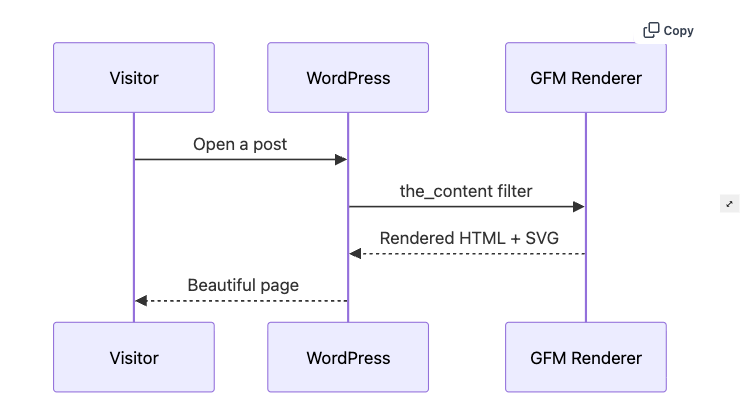
sequenceDiagram
    participant V as Visitor
    participant W as WordPress
    participant R as GFM Renderer
    V->>W: Open a post
    W->>R: the_content filter
    R-->>W: Rendered HTML + SVG
    W-->>V: Beautiful page
```
````
> **Lightbox feature**
> On the live page, clicking a Mermaid diagram opens a full-screen view with pan & zoom. Try it on the [demo site](https://markdown-renderer.wakalab.dev/2026/06/10/gfm-mermaid-rendering-examples/).
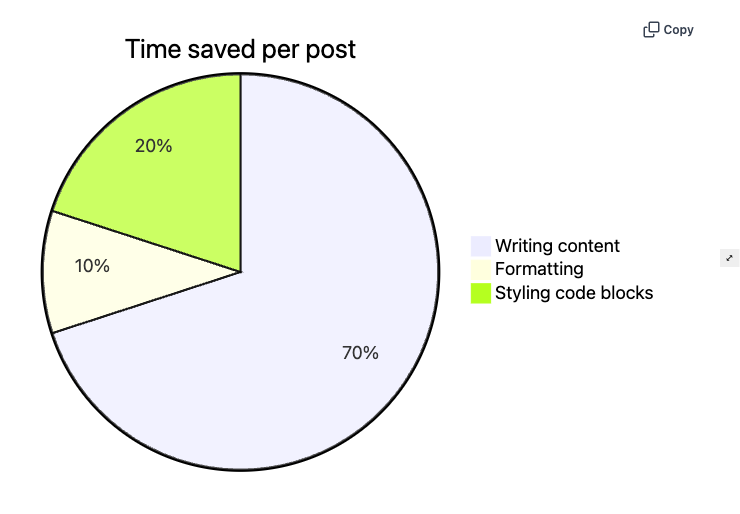
### Pie Chart (Mermaid)
````markdown
```mermaid
pie title Time saved per post
    "Writing content" : 70
    "Formatting" : 10
    "Styling code blocks" : 20
```
````
## Interactive Charts (Chart.js)
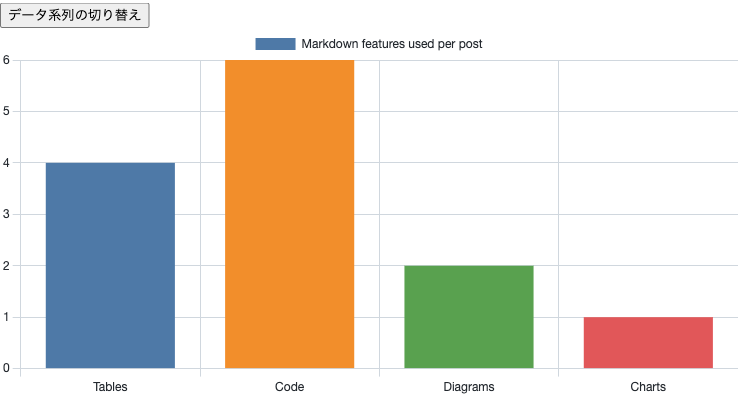
Just write JSON in a `chart` code fence and it renders as a responsive, interactive Chart.js chart:
````markdown
```chart
{
  "type": "bar",
  "data": {
    "labels": ["Tables", "Code", "Diagrams", "Charts"],
    "datasets": [{
      "label": "Markdown features used per post",
      "data": [4, 6, 2, 1],
      "backgroundColor": ["#4e79a7", "#f28e2b", "#59a14f", "#e15759"]
    }]
  }
}
```
````
## Try It Yourself
- 🔗 [Open the live demo post](https://markdown-renderer.wakalab.dev/2026/06/10/gfm-mermaid-rendering-examples/) — the source of the screenshots above
- 📦 [Product overview](/markdown-renderer-for-github/) — features, pricing, and installation
- 🚀 [Plans & Pricing](/markdown-renderer-for-github/pricing) — get the Pro edition
Every screenshot below is the real output of Markdown Renderer for GitHub running on a live WordPress site (not a mockup). Each example pairs the Markdown you write with the result your visitors see.
🔗 View this page on the demo site
GitHub Flavored Markdown
Tables
Write a GFM table as-is:
| Feature | Free | Pro |
|---------|:----:|:---:|
| GitHub Flavored Markdown | ✅ | ✅ |
| Syntax highlighting (30+ languages) | ✅ | ✅ |
| Mermaid diagrams | ✅ | ✅ |
| Interactive charts (Chart.js) | ✅ | ✅ |
| Standalone mode (outside WordPress) | — | ✅ |
It renders with GitHub-style borders, alignment, and zebra striping:

Syntax Highlighting
Code fences are highlighted with Shiki (the same engine as VS Code) and get a copy button:
```javascript
// Asynchronous rendering pipeline
async function renderMarkdown(source) {
const blocks = parseGfm(source);
const html = await Promise.all(blocks.map(toHtml));
return html.join('\n');
}
```

Mermaid Diagrams
Flowchart
```mermaid
flowchart LR
A[Write Markdown] --> B{GFM Renderer}
B -->|Code| C[Highlighted blocks]
B -->|Diagrams| D[Mermaid SVG]
B -->|Charts| E[Interactive charts]
C --> F[Published post]
D --> F
E --> F
```

Sequence Diagram
```mermaid
sequenceDiagram
participant V as Visitor
participant W as WordPress
participant R as GFM Renderer
V->>W: Open a post
W->>R: the_content filter
R-->>W: Rendered HTML + SVG
W-->>V: Beautiful page
```

Lightbox feature
On the live page, clicking a Mermaid diagram opens a full-screen view with pan & zoom. Try it on the demo site.
Pie Chart (Mermaid)
```mermaid
pie title Time saved per post
"Writing content" : 70
"Formatting" : 10
"Styling code blocks" : 20
```

Interactive Charts (Chart.js)
Just write JSON in a chart code fence and it renders as a responsive, interactive Chart.js chart:
```chart
{
"type": "bar",
"data": {
"labels": ["Tables", "Code", "Diagrams", "Charts"],
"datasets": [{
"label": "Markdown features used per post",
"data": [4, 6, 2, 1],
"backgroundColor": ["#4e79a7", "#f28e2b", "#59a14f", "#e15759"]
}]
}
}
```

Try It Yourself